Manchester United’s problems extend beyond Michael Carrick. My reading of the evidence is that the board and owners carry the greatest responsibility for the prolonged underperformance, while Carrick and the players share responsibility for the current results.
The manager is the most visible person to change. Replacing him is also an easier decision to explain than admitting that recruitment, squad planning and the way football decisions are made need attention. That is why the people appointing the manager deserve a performance review of their own.
This is a football argument, but it has a familiar shape for anyone who works with business investment: expensive inputs, inconsistent outcomes and a tendency to replace the person nearest the problem before examining the decisions that created it.
Published 27 October 2026. Match results are through 25 October 2026. The tactical figures below cover an earlier, explicitly identified five-match sample.
What is wrong with Manchester United? Start with the evidence
After the Bournemouth defeat, United were 16th, with seven points from eight Premier League matches. They had won twice in 12 games across all competitions. Reuters’s report on the 3–0 defeat sets out the immediate crisis.
Those results justify scrutiny of the coach and players. They do not explain why a club with United’s resources has struggled to sustain league success across so many different teams and managers.
The boardroom problem predates Carrick
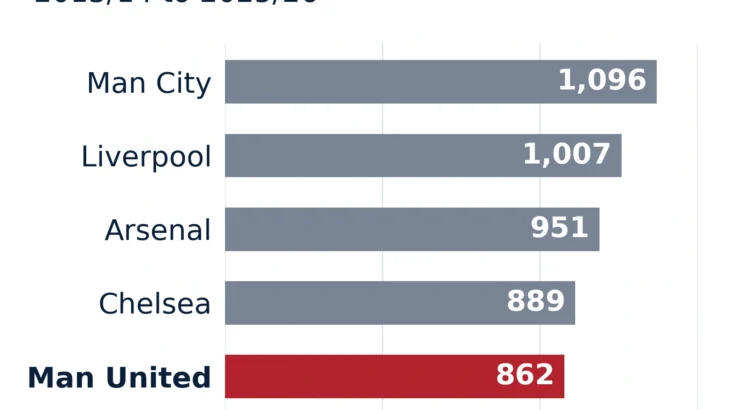
Across the 13 completed Premier League seasons from 2013/14 to 2025/26, United accumulated 234 fewer points than Manchester City. That is an average gap of 18 points per season. United finished in the top three only five times in that period, according to Opta’s historical comparison.
The persistence of the gap matters. Individual managerial mistakes can explain individual seasons. Repeated disappointment across changing coaches and squads makes the quality and continuity of football leadership a central part of the explanation.
The spending evidence strengthens that case. CIES’s five-year comparison during the 2025/26 season placed United second for net transfer expenditure across the ten windows it examined: €859 million, behind Chelsea’s €883 million. Its figures include add-ons regardless of whether they have been paid.
That is substantial player investment. The question for the board is how effectively it has produced a balanced squad, a consistent way of playing and repeatable results. Transfer expenditure measures buying activity; the quality of the resulting team is the outcome that matters.
There is money coming in, and a cost to repeated rebuilding
United’s financial results for the year ended 30 June 2026 show considerable commercial strength alongside constraints on financial flexibility.
| Financial measure | Year ended / position at 30 June 2026 |
|---|---|
| Revenue | £677.6 million |
| Net loss | £43.0 million |
| Current and non-current borrowings | £689.0 million |
| Cash interest paid during the year | £38.8 million |
The borrowings figure combines current and non-current borrowings and excludes transfer payables. Cash interest paid is taken from the cash flow statement. It should not be confused with the larger accounting figure for net finance costs, which includes foreign exchange effects.
My interpretation is that poor recruitment has an accumulating cost. Contracts, replacement fees and financing obligations influence the next decision as well as the last one. Another rebuilding exercise needs better choices, not simply a bigger headline budget.
Responsibility also needs to reflect control. The Glazers carry the historical ownership responsibility. INEOS must answer for football decisions under its management: the agreement announced in December 2023 delegated football operations to INEOS. Ratcliffe’s team is part of the accountability chain.
Carrick’s successful spell was a result, not a complete diagnosis
Carrick’s initial league return was excellent: 39 points from 17 matches, comprising 12 wins, three draws and two defeats. The opening eight league games this season produced one win, four draws and three defeats. The change in points per match is stark.

Opta’s expected-points model puts United tenth this season; Carrick’s interim spell delivered 12.7 points above expectation. Opta figures reported by the Guardian.
Expected points is a model of results based on chances. It cannot isolate coaching ability from player quality, finishing and goalkeeping. Equally, league position alone is an incomplete assessment of whether a team’s performances are improving sustainably.
For the board, that creates a decision-making test: did it examine the underlying football closely enough before treating the initial recovery as evidence that the longer-term appointment and squad plan were right?
The tactical data gives Carrick questions to answer
Opta’s analysis published on 8 October, covering the opening five league matches, showed a mixed attacking and defensive picture. These figures should not be presented as eight-match totals.
| Indicator | United’s opening five league matches |
|---|---|
| Shots attempted | 113, highest in the league |
| Non-penalty expected goals | 9.1, fourth-highest |
| Non-penalty xG per shot | 0.08, joint-second-lowest |
| High turnovers won | 26, ranked 15th |
| Runs tracking opponents out of possession | Bottom of the league |
United generated substantial attacking volume, so an explanation based entirely on an inability to create chances would be weak. But the average attempt was low quality, and the pressing and tracking indicators expose problems with how the team functioned without the ball.
Coaching, organisation and execution overlap here. Carrick must improve how United attack organised defences, coordinate pressure and protect the spaces opponents exploit. His successful first spell does not remove those responsibilities.
The players have responsibilities too
United scored ten league goals in the opening eight matches, with five coming in the single win against Ipswich. The other seven matches produced just five goals. Mbeumo supplied four of the ten league goals, which also shows why a blanket judgement about every player would be unhelpful. These figures come from the season match record.
Individual execution also contributed directly to the Bournemouth result. Sky’s match report identifies Heaven conceding the free-kick before the opener, Yoro slipping before the second and Evanilson beating Lammens to the ball for the third.
Players should answer for those actions. Claims about whether an entire squad has stopped trying require stronger evidence. Physical output is affected by tactics, possession, fitness and fatigue, while visible frustration tells us little about the cause of poor performance.
Squad preparation belongs in the same discussion. Before the season, Opta highlighted midfield depth and left-back cover. United played only 40 competitive matches in 2025/26. Returning to Europe meant a minimum of 48 this season, a 20% increase before progressing in any competition. That extra demand was foreseeable.
Who should be held accountable, and for what?
| Accountability | The performance review should cover |
|---|---|
| Board and owners | Football strategy, recruitment leadership, squad balance, contracts and managerial appointments |
| Manager and coaching staff | Tactical organisation, selection, player development and adapting to opponents |
| Players | Decisions, errors, tracking responsibilities and execution of the agreed plan |
This is a responsibility framework, not a numerical allocation of blame. The public data cannot honestly tell us that one group is 60% responsible and another is 25% responsible. It does support a broader conclusion: the long-running problem demands a review of the football leadership as well as the current team.
The business lesson: review the decisions behind the performance
There is a recognisable version of this pattern in data and AI programmes. An organisation buys a platform, appoints a delivery lead and sets an ambitious target. When results disappoint, the discussion turns quickly to a replacement supplier, a different tool or another round of training.
Each might be justified. The leadership questions still need answering: who chose the priorities, who owns the outcome, what capability was funded, and what evidence would show that the investment is working?
A football transfer budget and an AI business case are different things. The shared management mistake is treating investment and activity as proof of progress. Licence counts, dashboards delivered and training attendance can all rise while the underlying business outcome remains unchanged.
That is why I would put these questions in front of a leadership team before approving its next reset:
- What outcome are we trying to improve? Name the operational or commercial result and record its baseline.
- Who owns the whole decision? Include prioritisation, funding, delivery and adoption, with authority to resolve trade-offs.
- Do the capabilities fit together? Assess people, processes, data and technology as a working system.
- Which measures show sustainable improvement? Pair the final result with evidence about quality, reliability, cost and risk.
- What will change in the way we make decisions? A replacement person or platform needs a credible explanation of how the surrounding conditions will improve.
My Time Saved to Business Value Framework applies the same discipline to AI productivity: released capacity needs an owner and a deliberate use before it becomes a business benefit.
Put accountable data leadership behind your next investment
If your organisation has invested in data platforms, analytics or AI but cannot explain the return, my Data Leadership as a Service provides fractional CDO or Head of Data support across strategy, governance, platform decisions and team development.
The starting point is to assess where you are, agree the outcomes and build a practical roadmap. Bring the decisions and investments you are wrestling with to a discovery call.
For a first look at your organisation’s AI position, take the free AI Readiness Assessment.
Sources and scope
The article uses published league results, Opta analysis, CIES transfer research and Manchester United’s company financial release, linked beside the relevant claims. Match data ends on 25 October 2026. The tactical table is a five-match snapshot published on 8 October. The historical chart covers thirteen completed seasons. Different opponents, injuries, squad changes and scheduling limit direct comparisons. The allocation of responsibility is my interpretation of the evidence, rather than a causal estimate. The featured image is an original AI-generated editorial illustration; the charts use the figures identified in their captions.
PakarPBN
A Private Blog Network (PBN) is a collection of websites that are controlled by a single individual or organization and used primarily to build backlinks to a “money site” in order to influence its ranking in search engines such as Google. The core idea behind a PBN is based on the importance of backlinks in Google’s ranking algorithm. Since Google views backlinks as signals of authority and trust, some website owners attempt to artificially create these signals through a controlled network of sites.
In a typical PBN setup, the owner acquires expired or aged domains that already have existing authority, backlinks, and history. These domains are rebuilt with new content and hosted separately, often using different IP addresses, hosting providers, themes, and ownership details to make them appear unrelated. Within the content published on these sites, links are strategically placed that point to the main website the owner wants to rank higher. By doing this, the owner attempts to pass link equity (also known as “link juice”) from the PBN sites to the target website.
The purpose of a PBN is to give the impression that the target website is naturally earning links from multiple independent sources. If done effectively, this can temporarily improve keyword rankings, increase organic visibility, and drive more traffic from search results.